


 21/03/2017
Fixed Service – Radio Spectrum Use and Trends
21/3/2017
The distribution of number of links in each frequency band (from 1.7 GHz up to 86 GHz) in Fixed
Service in Greece for the period between years 2010 and 2016, is shown in figure 1.
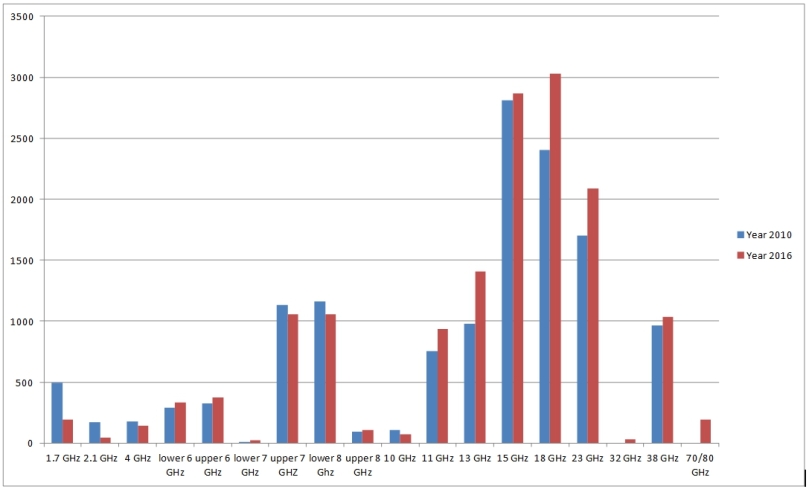
Fig.1: Number of fixed service links in low/mid/high range frequency bands in Greece for the
period between 2010 and 2016.
A comparison of the data extracted from the National Frequency Register on 01.01.2011 (year
2010) and on 07.10.2016 (year 2016) allows an evaluation of the overall FS developments between
2010 and 2016.
| Frequency Bands | Year 2010 | Year 2016 | trend |
| Low Range (1-10 GHz) | 3855 | 3336 | -13.5% |
| Mid Range (10-20 GHz) | 7052 | 8309 | +17.8% |
| High Range (20-50 GHz) | 2667 | 3149 | +18.1% |
The main changes and trends during the period 2010-2016 are summarized below:
- The number of P-P links in low range frequency bands (1.7 GHz, 2.1 GHz, 4 GHz, lower 6 GHz,
upper 6 GHz, lower 7, upper 7, lower 8 GHz, upper 8 GHz) has decreased with 13.5%. - The number of P-P links in mid-range frequency bands (10 GHz, 11 GHz, 13 GHz, 15 GHz, 18 GHz)
has increased with 17.8%. - The number of P-P links in high range frequency bands (23 GHz, 32 GHz, 38 GHz) has
increased with 18.1 %. - Two new frequency bands (32 GHz and 70/80 GHz) were introduced and used during this
period. - The 18 GHz frequency band appears the most significant in terms of number of links.
- The 13 GHz, 70/80 GHz frequency bands presented the highest growth.
Band by band statistics are provided in
Fixed
Service band by band statistics.