


Total number of mobile, fixed and non-geographical numbers (series 800, 801, 90, etc.) that have been ported per year from the start of number portability processes in Greece. Data derived from the National Reference Database for Number Portability (NRDBP).
Last update: 12/05/2026
Ported numbers 2004-2025
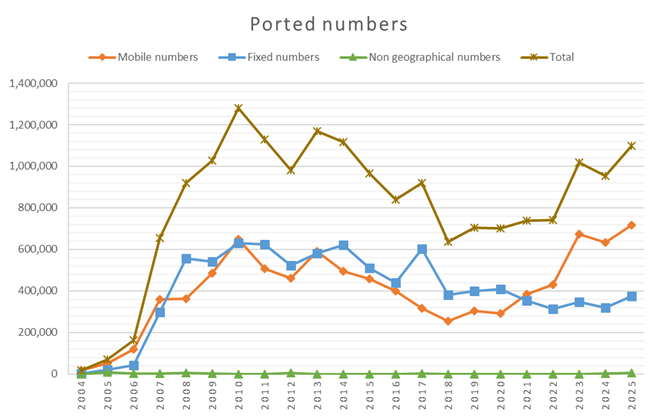
Detailed number portability data 2004-2024
Year | Mobile numbers | Fixed numbers | Non-geographical numbers | Total |
|---|---|---|---|---|
2004* | 16.123 | 1.120 | 36 | 17.243 |
2005 | 49.641 | 19.862 | 7.541 | 69.503 |
2006 | 117.766 | 42.767 | 2.032 | 160.533 |
2007 | 358.517 | 297.733 | 2.945 | 656.250 |
2008 | 362.601 | 556.810 | 6.060 | 919.411 |
2009 | 486.815 | 542.091 | 2.028 | 1.028.906 |
2010 | 648.074 | 631.562 | 49 | 1.279.636 |
2011 | 506.412 | 622.567 | 267 | 1.128.979 |
2012 | 459.941 | 521.924 | 4.554 | 981.865 |
2013 | 589.368 | 580.037 | 40 | 1.169.405 |
2014 | 495.032 | 621.006 | 26 | 1.116.038 |
2015 | 456.247 | 509.611 | 45 | 965.858 |
2016 | 399.764 | 440.026 | 34 | 839.790 |
2017 | 314.846 | 603.325 | 373 | 918.171 |
2018 | 255.694 | 380.088 | 40 | 635.782 |
2019 | 302.838 | 400.537 | 50 | 703.375 |
2020 | 291.740 | 409.327 | 31 | 701.067 |
2021 | 383.868 | 352.568 | 38 | 736.436 |
2022 | 429.045 | 312.583 | 18 | 741.628 |
2023 | 673.187 | 346.113 | 17 | 1.019.300 |
2024 | 633.665 | 317.925 | 340 | 951.930 |
2025 | 715.926 | 374.411 | 6.392 | 1.096.729 |
Grand total | 8.947.110 | 8.883.993 | 32.956 | 17.864.059 |
* Data from 1/3/2004, starting date of number portability processes through NRDBP.